
As the founder and president of FoundationMark, John Seitz analyzes mountains of data gleaned from funders’ Form 990s to track the investment performance of private foundations and surface trends animating the sector.
For instance, last June, Seitz crunched data from the 40 largest U.S. foundations by total assets and determined that 17 of the 36 for which information was available for the last five years failed to hit an average 5% payout during that time frame.
Since foundations’ 2022 Form 990s are now publicly available, I figured it was a good time to check back in with Seitz to see if he could take a deep dive into pandemic-era trends around foundations’ assets, grantmaking and expenses. He was all for it.
Seitz’s first order of business was setting parameters for the data set. Foundations must have had more than $200 million in annual assets starting in 2014, have submitted a Form 990 every year from 2014 through 2022 (excluding Bloomberg Philanthropies, which did not submit a 2018 Form 990), and have a December end-of-tax year (excluding the W.K. Kellogg Foundation and Helmsley Charitable Trust) to “ensure that timing periods were apples to apples,” Seitz said via email.
Foundations also had to disburse grants (excluding art museums) and have annual cash flow under 25%. This latter stipulation removed foundations that were ramping or winding down from the data set. Lastly, Seitz capped foundation assets at $25 billion to exclude the Gates Foundation and the Lilly Endowment from the data. “They are outliers, so any changes they make have a disproportionate effect on any trend,” he said.
The exercise generated a data set of 230 foundations that collectively control 20% of total assets across the larger funding ecosystem. “This is a group that I believe represents a good view of ‘industry trends,’” Seitz said.
Let’s see what the numbers tell us.
Takeaway No. 1: The foundations in the data set stepped up giving during the pandemic before cooling off in 2022
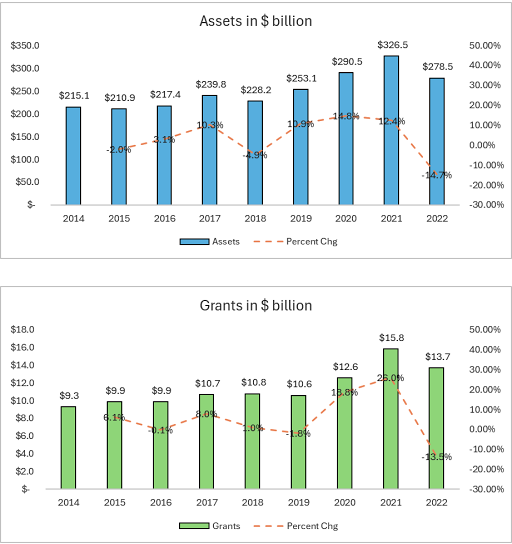
Seitz added up the 230 foundations’ assets by year and the amount in grants they moved out the door from 2014 to 2022.
“In terms of assets and grants, this group seems to have really ratcheted up grants in the pandemic, before cooling to a long-term trend in 2022,” Seitz said.
We can attribute this decrease to the likelihood that trustees determined that a sustained ramp-up could threaten the foundation’s perpetuity. As Seitz noted, “If the payout ratio is higher than investment returns, that is a path to a shrinking foundation.”
Nonetheless, despite dropping 13.5% in 2022, that year’s average grantmaking from these 230 foundations was still 30% higher than in 2019.
One would surmise that this group’s 13.5% decrease in grantmaking from 2021 to 2022 would drag down the aggregate field. However, the foundations controlling 80% of the remaining assets picked up the slack by increasing grantmaking at a more measured rate — 6.5%, 9.9% and 12% in 2020, 2021 and 2022, respectively. As a result, total grantmaking from all foundations rose 6% from 2021 to 2022, from $78 billion to $83 billion.
Takeaway No. 2: Foundation giving is “all over the map”
Here are changes in annual giving from the largest 10 foundations in the data set.
Changes in Annual Giving Among 10 Largest Foundations
| Annual Giving Change | ||||
| Total assets ($ billions) | Name | 2020 | 2021 | 2022 |
| $16.4 | Ford Foundation | 36.5% | 13.3% | -11.2% |
| $13.8 | Robert Wood Johnson Foundation | 16.9% | 13.3% | -1.8% |
| $12.8 | William & Flora Hewlett Foundation | 29.8% | 11.7% | 5.5% |
| $10.6 | Foundation to Promote Open Society | 37.5% | 13.2% | -27.6% |
| $8.3 | Gordon E. and Betty I. Moore Foundation | -9.2% | 27% | 14.4% |
| $8.3 | David and Lucile Packard Foundation | -1.0% | 24.6% | 0.6% |
| $8.2 | John D. and Catherine T. MacArthur Foundation | 7.8% | 4.8% | -7.7% |
| $8.2 | Mellon Foundation | 30.8% | 2.7% | 22.1% |
| $6.1 | Rockefeller Foundation | 19.3% | 113.4% | -27.3% |
| $5 | Duke Endowment | 7.3% | 2.6% | 18.7% |
The takeaway here is self-evident: “Changes in giving during the last three years were all over the map,” Seitz said. “Foundations do not all behave in the same way — some increase giving while others pull back.”
The 230 foundations in the data set represent what Seitz calls “the ‘old guard’ of foundations — no new money coming in, so they need to manage spending around their endowment, so I imagined that their giving would vary in single digits.”
But as the table illustrates, multiple foundations had double-digit year-over-year changes in grantmaking, calling into question the idea that these are risk-averse foundations that always take a relatively measured approach when it comes to moving money out the door.
Takeaway No. 3: Expenses and people costs rose considerably in 2022
Seitz added up the 230 foundations’ combined discretionary operating expenses per year — excluding interest, depreciation and taxes — from 2014 to 2022. (Note: the figures are in the millions.)
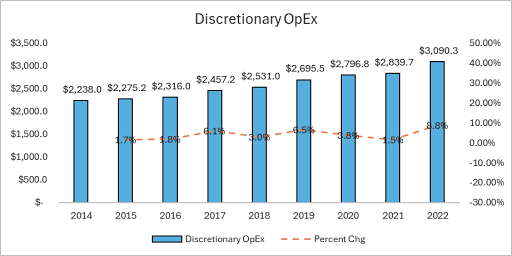
Readers will note that operational expenses jumped 8.8% from $2.8 billion in 2021 to $3.1 billion in 2022 — the largest year-over-year change in the data set. Seitz took a closer look at foundations’ expense line items and found that expenses earmarked as “salaries” jumped 12.5% from 2021 to 2022. Foundations were hiring more staff, increasing salaries, or both.
Seitz also broke out the 230 foundations’ operating expenses in 2022 by category.
Foundation Operating Expenses ($ million) in 2022
| Expense | Amount | Percent of Total |
| People (includes trustee compensation, employee salaries and pensions and benefits) | $1,291.40 | 41.8% |
| Other professional fees (mainly investment management) | $839.20 | 27.2% |
| Other expenses | $659.20 | 21.3% |
| Occupancy | $124.5 | 4.0% |
| Travel, meetings, publications | $109.07 | 3.5% |
| Legal and accounting | $66.85 | 2.2% |
The combined $1.3 billion in people costs — and especially salaries — “were the biggest driver of increased expenses” between 2021 and 2022, Seitz said. Travel also “had a very big bounce — it fell off a cliff during the pandemic, but it’s now back close to 2019 numbers.”
Seitz also looked at changes in people costs at the largest 10 foundations by asset size:
People Cost Change Among 10 Largest Foundations
| Annual People Cost Change | ||||
| 2022 Total Assets ($ billions) | Name | 2020 | 2021 | 2022 |
| $16.4 | Ford Foundation | -0.2% | 4.8% | 5.0% |
| $13.8 | Robert Wood Johnson Foundation | 13% | 1.1% | 18% |
| $12.8 | William & Flora Hewlett Foundation | 1.6% | 12.7% | 3.5% |
| $10.6 | Foundation to Promote Open Society | – | – | – |
| $8.3 | Gordon E. and Betty I. Moore Foundation | 3.5% | 2.8% | 15.7% |
| $8.3 | David and Lucile Packard Foundation | 9.3% | 11.5% | 6.2% |
| $8.2 | John D. and Catherine T. MacArthur Foundation | 5% | -17.6% | 9.2% |
| $8.2 | Mellon Foundation | 12.4% | 22.1% | 22% |
| $6.1 | Rockefeller Foundation | 15.4% | 16.4% | 19.1% |
| $5 | Duke Endowment | -10.6% | 13.4% | -11.8% |
Much like the previous table illustrating foundations’ year-over-year grantmaking, we see many double-digit changes in these foundations’ people costs. Seitz attributes this to the ebbs and flows of running a foundation. “Institutions tend to grow over time, while in any given year, asset levels may vary,” he said. “So I couldn’t look for short-term correlations to always be in sync.”